Dashboard Fatigue is Killing Your DTC Growth. Here is the AI Cure.
Stop checking Shopify dashboards 20 times a day. Learn how agentic monitoring and cron-native AI agents cure dashboard fatigue for DTC brands.
Vigor
Dashboard Fatigue is Killing Your DTC Growth. Here is the AI Cure.
 AI data analysis and dashboards
If you are a Shopify merchant doing $10k–$50k/mo, you are likely suffering from "Dashboard Fatigue." You log into Shopify Analytics, then Google Analytics 4, then Meta Ads Manager, then your shipping platform. You spend 45 minutes every morning just trying to answer one question: "Is my business actually healthy today?"
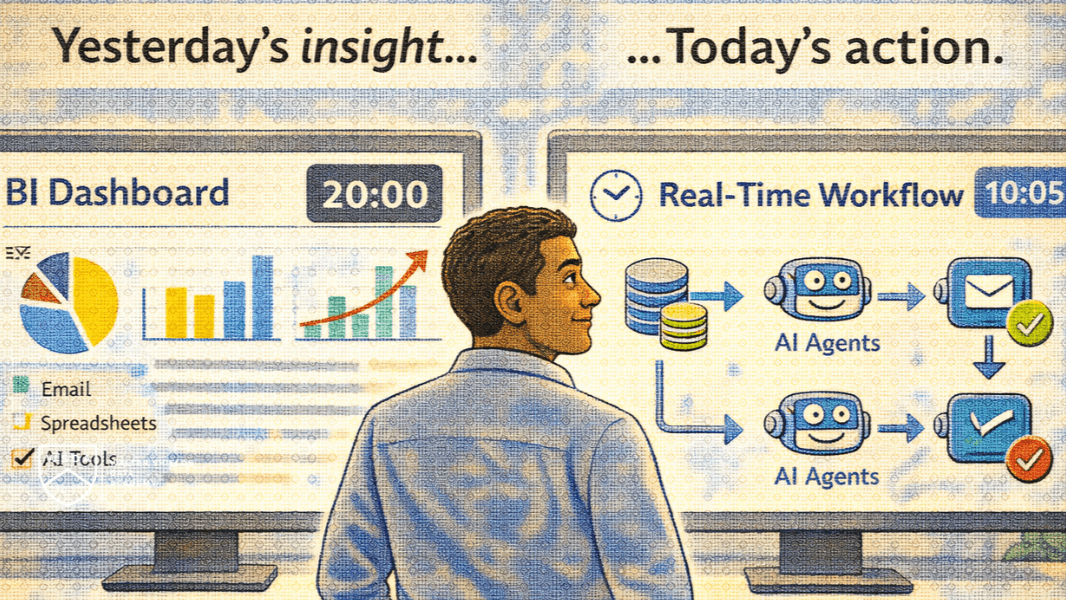
In 2026, the era of the passive dashboard is ending. The winning merchants are moving from reactive checking to proactive monitoring using agentic workflows. This guide breaks down the high cost of manual reporting and shows you how to deploy a "cron-native" AI agent that watches your metrics while you sleep.
TL;DR
- Dashboard Fatigue wastes 5–10 hours/week and leads to delayed decisions on ad spend and inventory.
- Agentic Monitoring replaces manual checking with scheduled briefs that alert you only when a metric (ROAS, Margin, stock) hits a threshold.
- The ROI Math: Recovering 30 hours/month of an owner’s time is worth $1,500+ in labor value alone.
- Action Plan: Start with a 7:30 AM "Morning Brief" that joins sales, spend, and support data.
- Internal Proof: See our guides on /blog/automate-shopify-morning-brief and /blog/ecommerce-analytics-tools-2026.
The Hidden Cost of the "Manual Check"
Most founders believe checking dashboards is "work." It isn’t. It’s overhead. Every minute you spend logging into a portal to copy a number into a spreadsheet is a minute you aren’t spent on product development, brand strategy, or high-level partnerships.
According to McKinsey’s research on generative AI productivity, the biggest gains in 2026 are coming from automating "knowledge work coordination." For an e-commerce brand, coordination is the reporting loop.
| Step | The Manual Way (Passive) | The Agentic Way (Proactive) |
|---|---|---|
| Data Collection | Login to 4+ portals | API-triggered collection at 07:00 |
| Metric Joining | Manual VLOOKUPs/Sheets | Automated join (Spend + Sales) |
| Anomaly Detection | "Vibe check" by the owner | Statistical threshold alerts |
| Delivery | You go to the data | The brief comes to your Telegram |
| Latency | 12–24 hours delayed | Real-time or scheduled (Cron) |
Why Most BI Tools Fail Shopify Sellers
Traditional BI tools like Looker or Tableau were built for analysts, not operators. They are still just dashboards—static boxes that wait for you to look at them. If a Meta ad set spikes in CPA at 2:00 AM, a dashboard won’t tell you until you log in at 9:00 AM.
An AI agent is different. It doesn’t just visualize; it reasons. As noted in the NIST AI Risk Management Framework, the value of autonomous systems in business is their ability to provide continuous monitoring within governed safety limits. An agent grounded in your Shopify Analytics understands that a refund spike in one SKU is more urgent than a 2% dip in site traffic.
Mini-Case: From 90 Minutes to 2 Minutes a Day
Context: A Shopify brand selling eco-friendly kitchenware (~$35k/mo revenue) was managed by a solo founder and one part-time VA.
The Pain: The founder spent the first 90 minutes of every day "getting the numbers straight" to decide which Meta ads to kill and which SKUs to reorder.
The Intervention: They deployed a BiClaw agent with two specific skills:
- The Morning Pulse: At 7:30 AM, a Telegram brief summarized Net Sales, Blended ROAS, and any SKU with <14 days of stock.
- The Ad-Spend Guardrail: The agent flagged any ad set where CPA exceeded 1.5x the target over a 72-hour window.
The Results (First 30 Days):
- Time Saved: 32 hours/month returned to the founder (approx. 8 hours/week).
- Revenue Impact: Caught a payment gateway error on a Tuesday afternoon that was causing a 40% checkout drop-off; fixed in 15 minutes instead of 15 hours.
- Labor Savings: Reallocated the VA’s 10 hours/week from data entry to customer outreach and influencer management.
- ROI: The system paid for its monthly subscription within the first 3 days of saved labor value.
Comparison: BI Dashboards vs. Agentic Monitoring
| Feature | Dashboard (Standard BI) | Agentic Monitoring (BiClaw) |
|---|---|---|
| Primary Interface | Browser Tab / Portal | WhatsApp / Telegram / Slack |
| Engagement | Reactive (You search) | Proactive (It alerts) |
| Reasoning | None (Visual only) | Contextual (Identifies why numbers moved) |
| Automation | None | Drafts actions (e.g., ad pauses, PO drafts) |
| Setup | High (Custom SQL/Charts) | Low (Pre-built commerce skills) |
How to Build Your Proactive Reporting Loop
If you want to move from passive dashboards to active growth, follow this 3-step playbook. You can implement this using the patterns found in our SOP to Autopilot guide.
1. Define Your "Red Flags"
Don’t monitor everything. Define the 3–5 numbers that, if they move, require an immediate change in strategy. Common examples:
- Blended ROAS < 2.0
- Refund Rate > 5%
- SKU stock-out risk < 10 days
2. Connect Your Semantic Layer
Ensure your AI understands the source of truth. Your revenue comes from Shopify; your spend comes from Meta. As we discuss in Why Business Needs BI-First AI, an agent without a semantic layer will hallucinate metrics.
3. Schedule the Delivery
Set a "cron-native" schedule. Your agent should pull data at 7:00 AM, reason over it for 15 minutes, and deliver the brief at 7:15 AM. This ensures you are operating on data, not vibes, by the time you start your workday.
The Winner in 2026: Outcome over Infrastructure
The market is currently flooded with "empty box" AI tools that require you to be a developer to get a single report. In 2026, the competitive advantage belongs to the merchant who buys the outcome, not the infrastructure.
Stop being a servant to your dashboards. Start running an agentic team that treats your data as a proactive growth tool. Ready to reclaim your mornings? Start a 7-day free trial at biclaw.app and see what happens when your data works for you.
Related Reading
- How to Automate Your Shopify Morning Brief
- E-commerce Analytics Tools for 2026
- Why Your Business Needs a BI-First AI Assistant
- From SOP to Autopilot: Using AI Agents
Sources: McKinsey — The economic potential of generative AI | NIST AI Risk Management Framework